3 Ways Data Can Help Shape Hybrid Decisions
Randy Mette
Seed Product Manager

Making good seed decisions starts with leveraging reliable, quality data. Ideally, this means fusing national data with highly localized data from your region or your farm specifically. Employ these three data-driven strategies to help ensure you are using the most relevant information when choosing your seed products for 2026.
1. Consider your field environment and management style.
Not all hybrids are created equal, and some respond better to certain management strategies than others. As you plan for 2026, response-to scores are a valuable tool to help match your seed choices to your management style, as well as to the characteristics of individual fields.
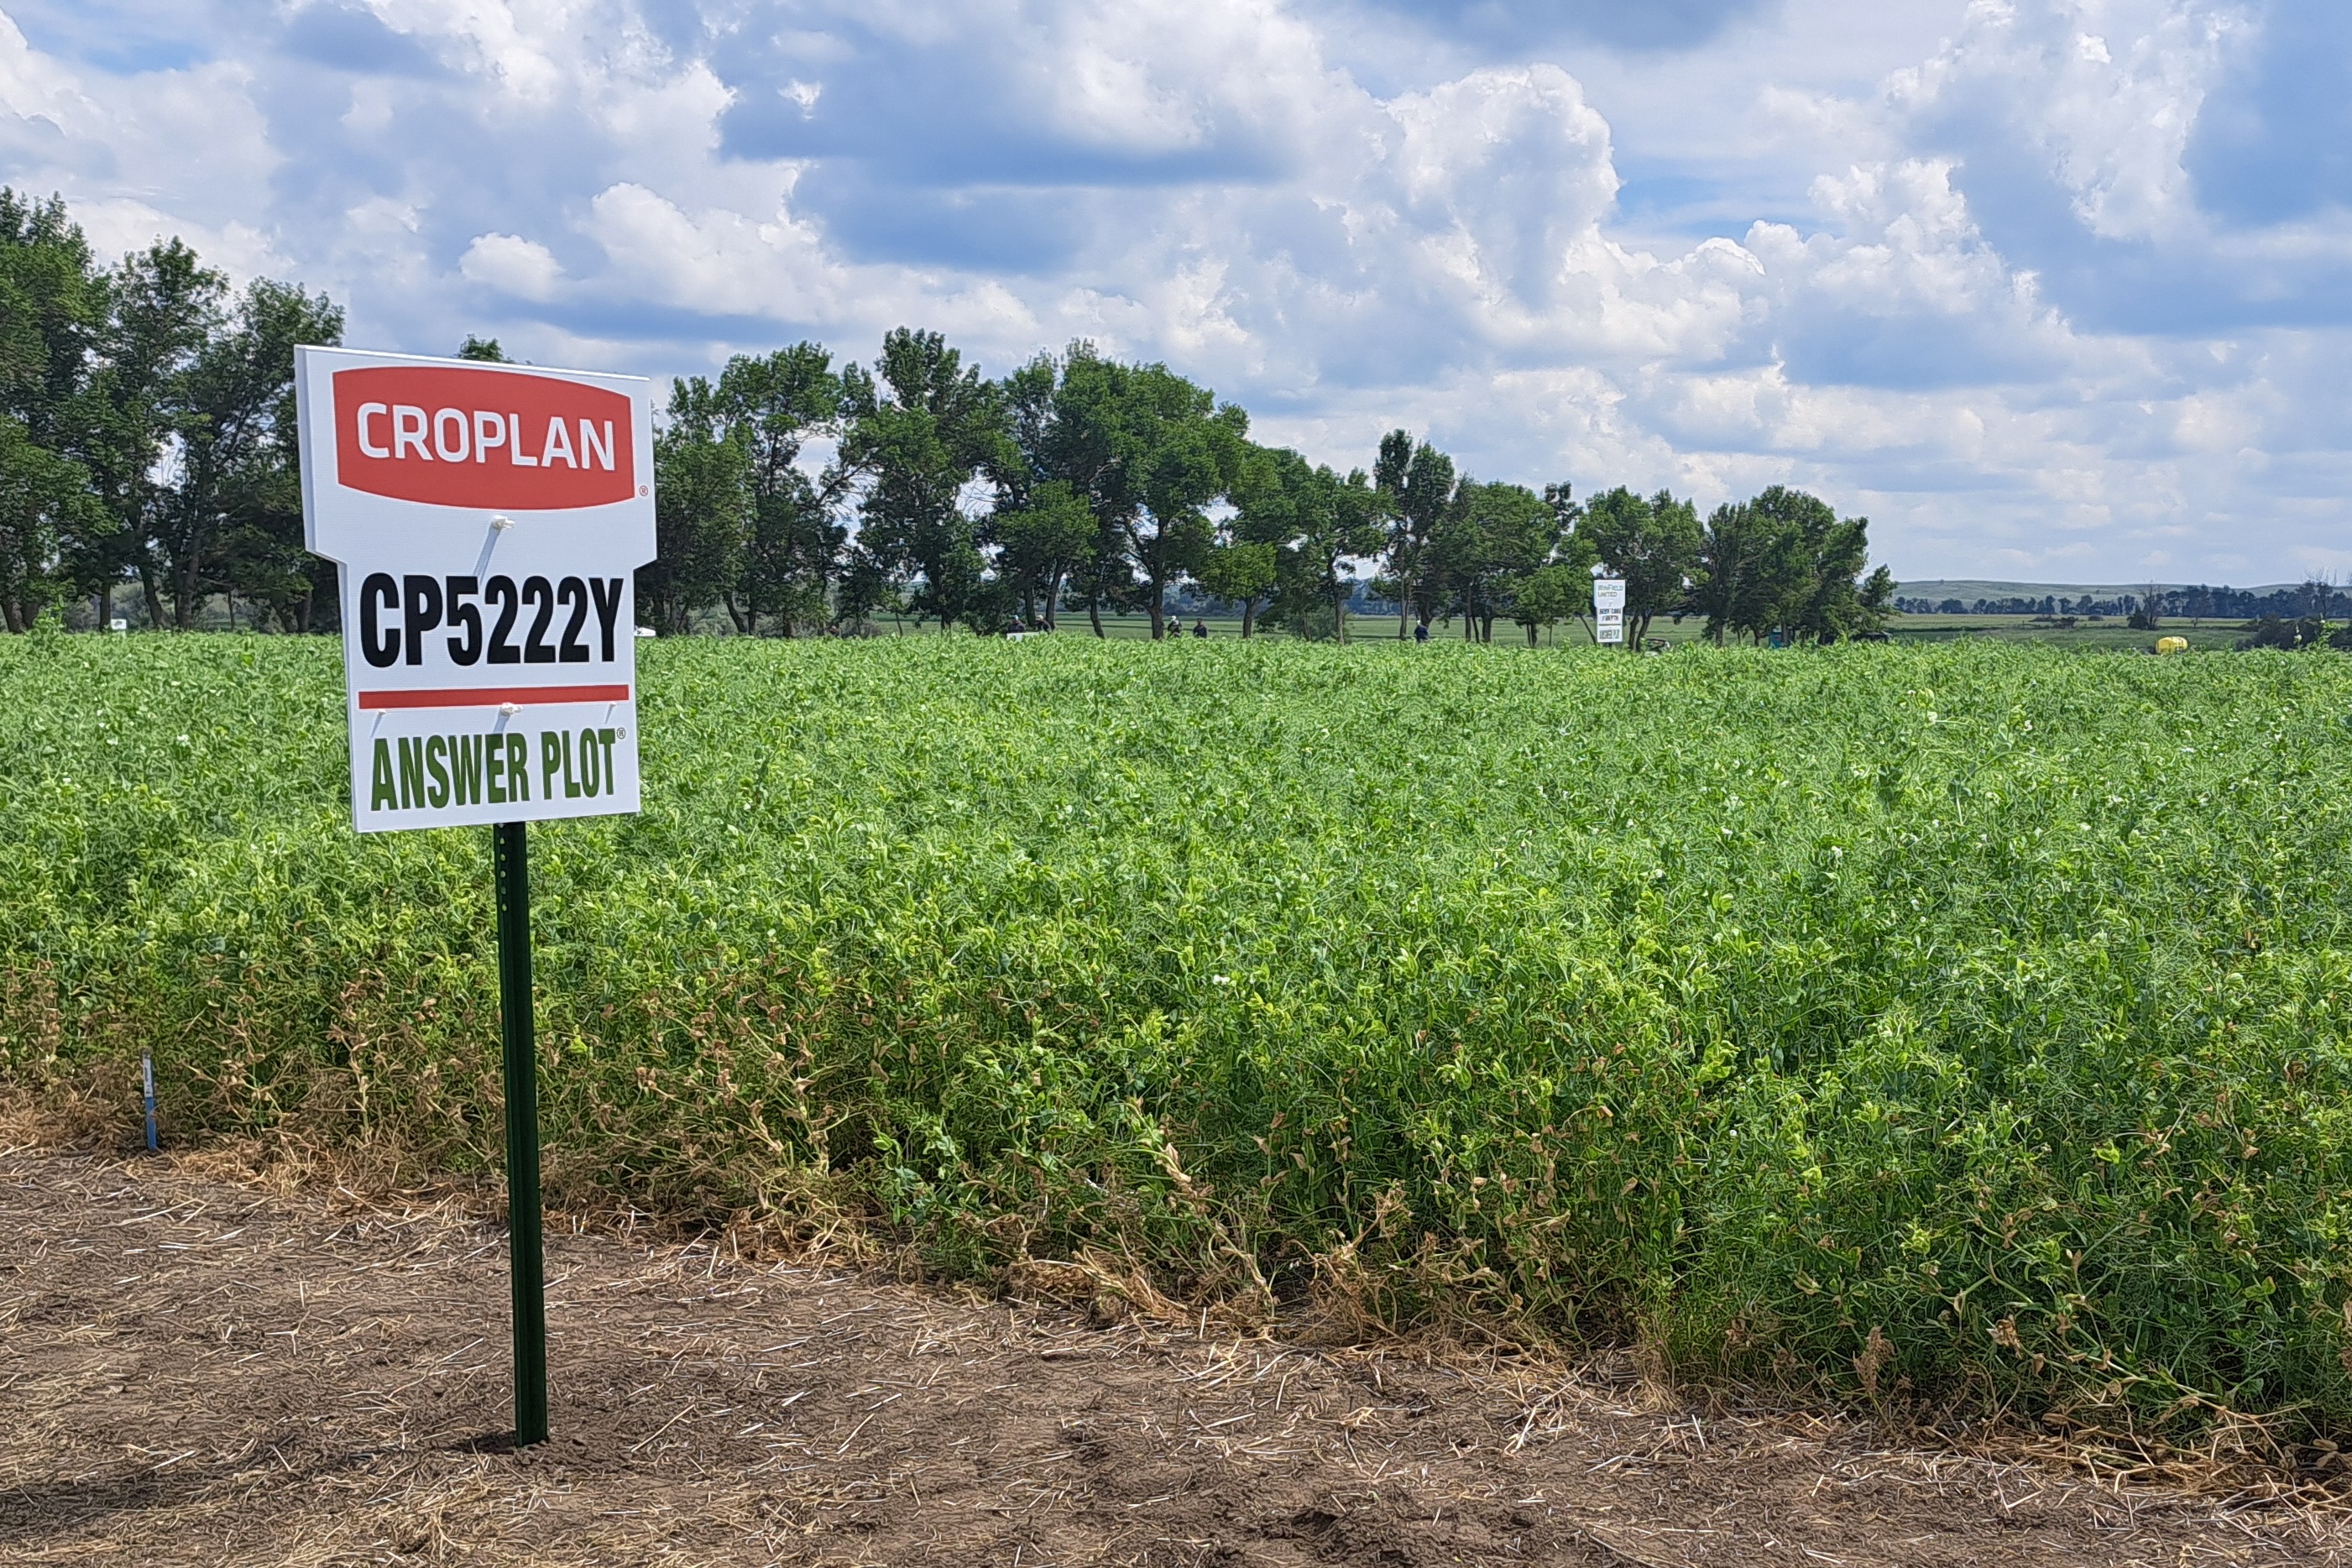
CROPLAN® seed generates nationwide location data including response-to data with our Answer Plot® program. Response-to scores measure how individual hybrids respond to population, nitrogen and fungicide applications. Using these scores can help you allocate your crop inputs budget more precisely, leading to more efficient and productive yields.
For example, the rising price of inputs over the years may steer you towards a less intensive management program. If that’s the case, choosing seed that responds favorably to fewer input applications is probably preferable to planting a hybrid with a high response to nitrogen or fungicide. Different seed products let you apply inputs less intensely but may still give you a ROI and yield potential acceptable to you, if you manage them as directed. Conversely, if you plan to pursue the high-yielding acre and use maximum inputs throughout the year, consider choosing seed with high response-to scores for the opportunity to achieve optimal yield potential through high management.
In 2024 Answer Plot research, we field tested hybrids for response to population (RTP), response to nitrogen (RTN) and response to fungicide (RTF). Yield responses highlight the importance of understanding how the hybrids you pick react to different management practices to optimize yield potential.
Response-to Test |
Average Yield Response |
| Response to Nitrogen | 36.5 bu/A1 |
| Response to Fungicide | 12.0 bu/A1 |
| Response to Population | 8.5 bu/A1 |
Planting a hybrid with a high RTN score and managing it with plenty of nitrogen, for example, added nearly 37
bushels per acre compared to planting the same hybrid under limited nitrogen conditions.1 Without proper crop management, those are bushels you may be leaving in the field.
2. Demand data that proves performance.
It used to be common practice to try a few different hybrids throughout the season, discard the ones that didn’t work and then rely on those that did the following season. Because of evolving technology, that isn’t feasible anymore. Hybrids don’t stay in the market as long as they used to since increases in yield potential and improved trait packages can make products obsolete much quicker than in the past. With that being said, just because a hybrid worked for you this year doesn’t necessarily mean it will work for you again next year. That also means just because a product didn’t work for you this year doesn’t necessarily mean you shouldn’t plant it again. This is where reliable data can help guide your selection process. Be sure your data is:
• Validated by replication. The more data points you have, the stronger the data. Our Answer Plot data is backed by extensive replicated trials and run through a quality assurance process to help ensure greater accuracy.
• Prescriptive, not descriptive. Graphs and spreadsheets about past performance have their places; but to be successful, you need data-driven recommendations for your farm. Our data offers you a clear idea of what to do in the future.
You should know how to manage products from the very first year you plant them. Every new CROPLAN product is rigorously tested in our Answer Plot system and evaluated even more in varying locations and conditions before going to market. So, the first year a product is in the market, we have data available to help you determine if it’s a worthwhile investment for your operation.
3. Consult your agronomist to review this year and plan for next.
At the end of the season, you’ll probably have a significant amount of data collected. Reviewing that much information can be overwhelming, so team up with your local retailer to correctly dissect it. Together, you can review what happened this season and determine what needs to be changed for next season. Maybe it’s using a new hybrid that fits your needs better. Maybe it’s putting together a more realistic management plan. Bottom line: You and your agronomist want to know what went wrong, what went right and how to do better in the future. Your agronomist can help you view the season holistically, considering critical management and input elements and creating a plan rooted in data.
Although you never know what the season will bring, the highest odds of success come from managing the seed as recommended. For more information on the Answer Plot program, technology tools and how to get the most out of your seed investment, talk with your CROPLAN local retail seed expert.
12024 Answer Plot data.
All photos are either the property of WinField United or used with permission.
© 2025 WinField United. Important: Before use always read and follow label instructions. Crop performance is dependent on several factors many of which are beyond the control of WinField United, including without limitation, soil type, pest pressures, agronomic practices and weather conditions. Growers are encouraged to consider data from multiple locations, over multiple years and to be mindful of how such agronomic conditions could impact results. Answer Plot, CROPLAN and WinField are trademarks of WinField United. All other trademarks are the property of their respective owners.
IF YOU LOVE OUR INSIGHT, YOU’LL LOVE OUR ROI POTENTIAL
Every successful harvest starts with a seed. It just can't end there. Choose which high-performing seed products you’ll start with this season.


